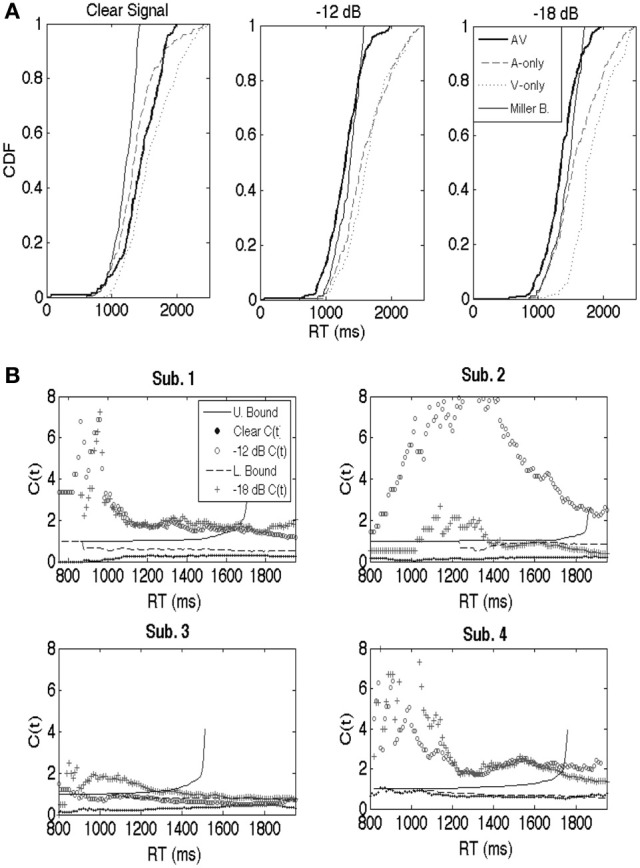
Figure 2.

(A) For purposes of illustration, cumulative distribution functions (CDFs; participant 4) are shown separately for the auditory-only, visual-only, and audiovisual trials for the clear, −12 dB, and −18 dB listening conditions. Miller and Grice bounds are plotted as well. (B) Similar to the CDFs, capacity is a continuous function. Results are shown separately for participants 1 through 4. Participant 1's results are shown in the upper left, 2's in the upper right, 3's in the lower left, and 4's in the bottom right. Each panel displays C(t) across each listening condition, as well as the upper (Miller) and lower (Grice) bounds translated into capacity space (cf. Townsend and Eidels, 2011 for equations). The symbols (clear, −12 dB, and −18 dB) denote the values for the capacity function. Note that there should be separate upper and lower for each auditory S/N ratio. Our strategy was to plot the averaged bounds to avoid clutter, although interpretations of the data would not have changed regardless of the bounds used.
