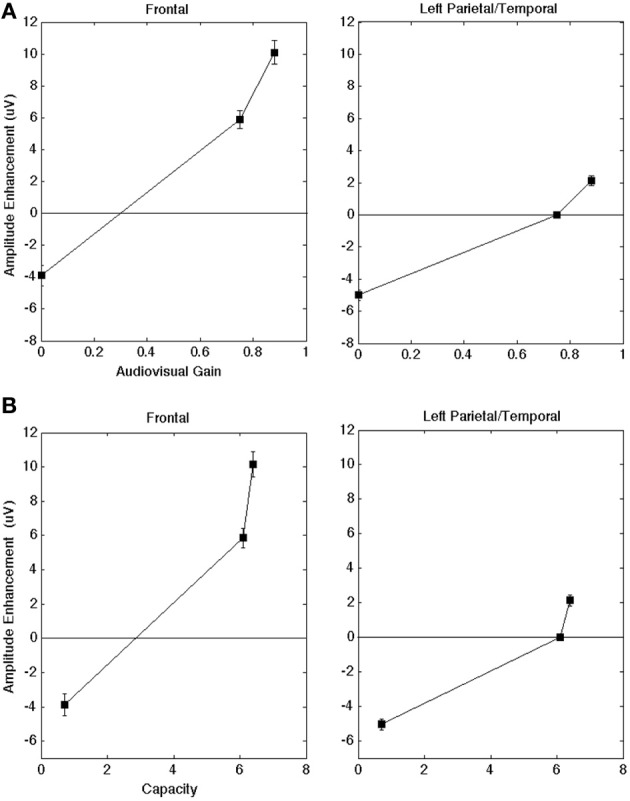
Figure 4.

(A) AV gain in amplitude for the peak ERP (AV − A) as a function of audiovisual gain across brain regions of interest. A positive value means that the average AV amplitude was larger than the A. The scores are collapsed across each of the four participants. (B) Audiovisual gain in amplitude as a function of capacity scores (in the clear, −12 dB, and −18 dB S/N ratio conditions, respectively) across brain regions of interest. The scores are collapsed across each of the four participants. Error bars denote one standard error of the mean computed across individual electrodes (across subjects) within a given region.
