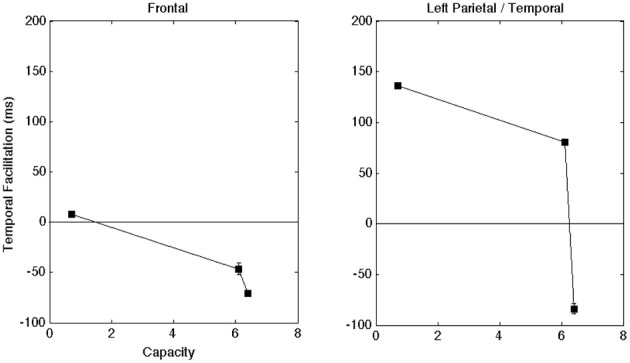
Figure 5.

Shows the latency differences in the ERP peak component plotted as a function of capacity for the frontal and left regions. A positive value means that the time-to-peak was faster in the AV compared to the A-only condition. Once again, error bars denote one standard error of the mean computed across individual electrodes (across subjects) in a given region.
