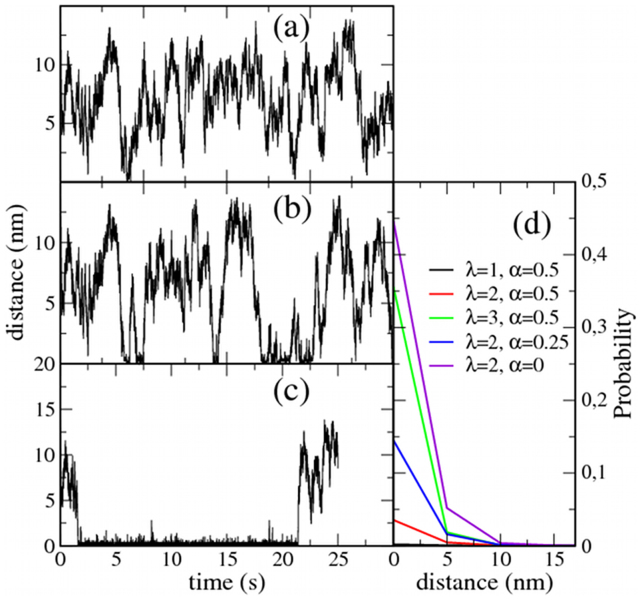
Figure 2. Trapping effect of static inclusions.
Simulations for a system with a single static trapping inclusion (NX = 1) and one mobile protein (NP = 1). The system size is 100 × 100 sites (0.25 μm2). The distance to the trapping inclusion is monitored for different cases. (a) λ = 1, α = 0.5: only a few very short trapping periods. (b) λ = 2, α = 0.5: increasing protein-lipid affinity promotes longer trapping periods. (c) λ = 2, α = 0: when the lipid mixture approaches the phase boundary, the mobile protein remains trapped most of the time. (d) Probability distribution for the P-X distance for different values of λ and α.

