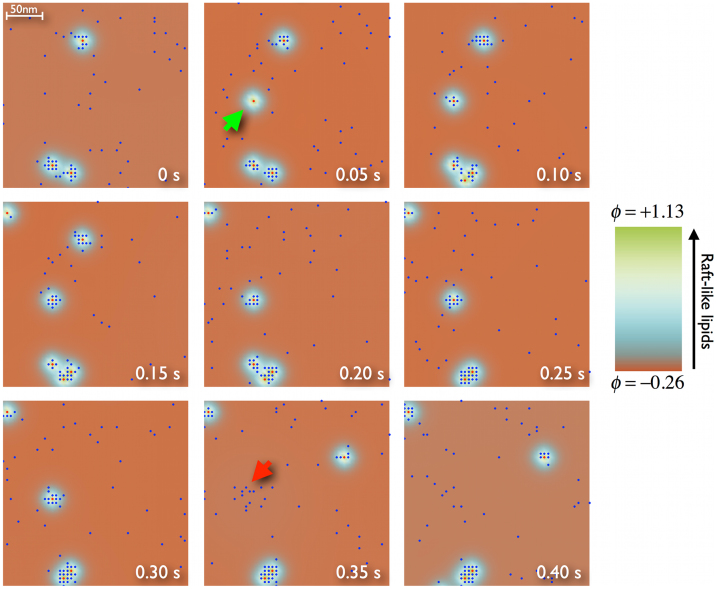
Figure 5. Transient trapping of proteins in clusters.
Sequence of snapshots corresponding to a simulated membrane of 1 μm2 containing 50 nucleating active inclusions X (red) and 1000 diffusing P proteins (blue) in a lipid media (color code on the right side). The model parameters are τ = 0.5 s, λ = 3, and α = 0.5. The sequence only shows a 0.4 μm2 subsection to observe the details of the cluster formation (green arrow) and destruction (red arrow) process. From left to right and top to bottom, the sequence covers the last 0.4 s of simulation (almost one time period τ).

