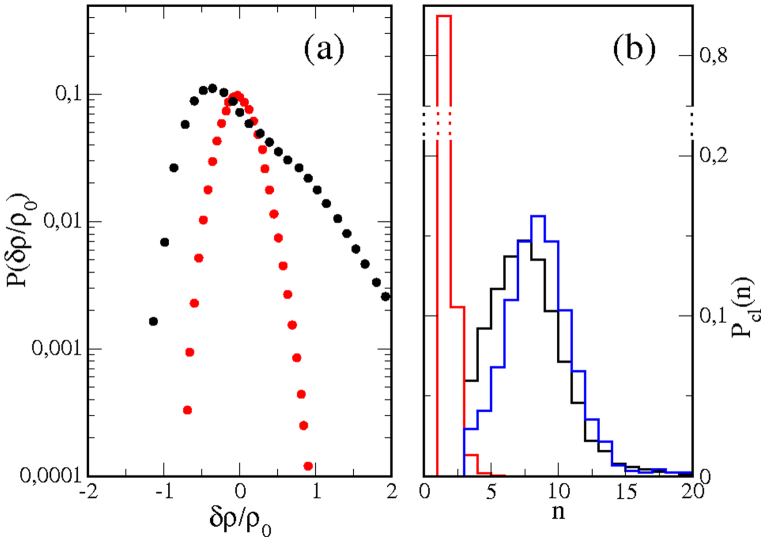
Figure 6. Density fluctuations and cluster distribution.
(a) Distribution of protein density fluctuations, P(δρ), for NP = 1000. Black: reference case (τ = 0.5 s, λ = 3, α = 0.5). Red: random case (no interactions). (b) Distribution of the probability of finding a protein cluster formed by n proteins, Pcl(n). Black: reference case (τ = 0.5 s, λ = 3, α = 0.5). Red: random case (no interactions). Blue: case with slower cytoskeleton dynamics (τ = 5 s, λ = 3, α = 0.5).

