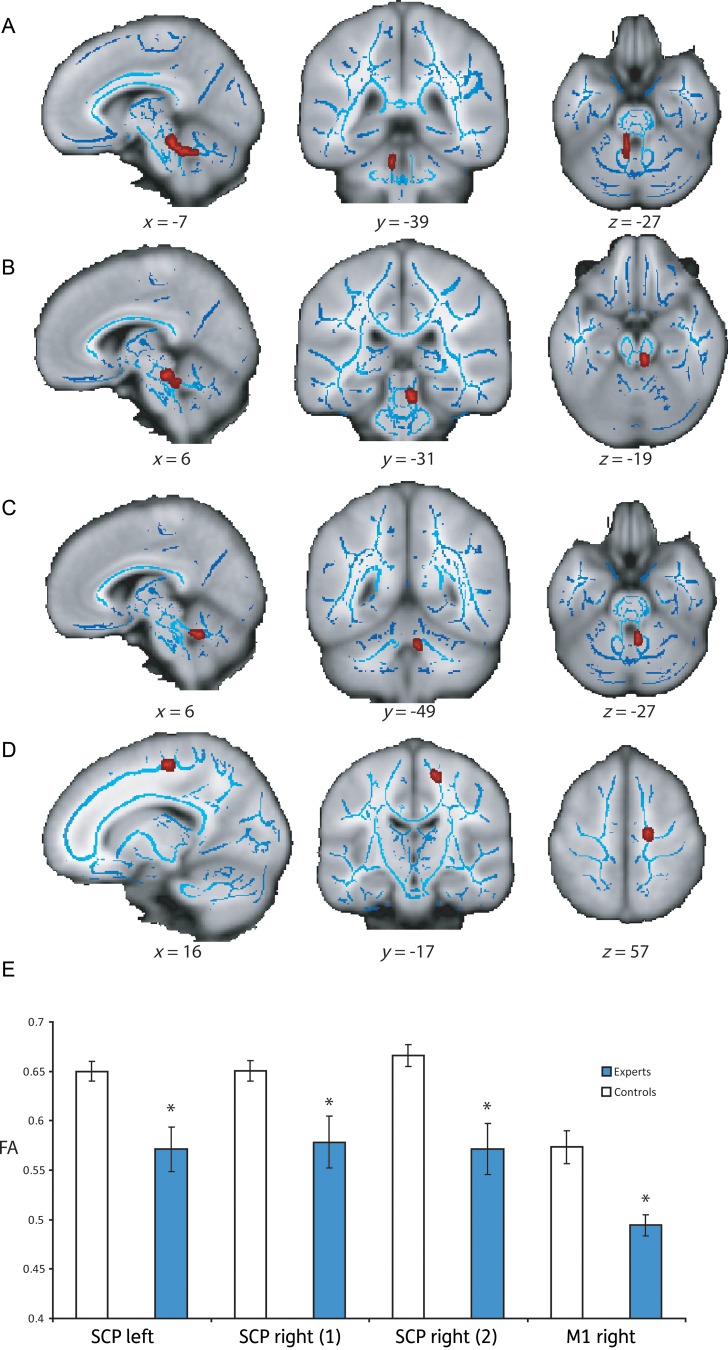
Figure 3.
Group differences in FA in the SCPs and M1. (A–D) The location of the clusters of voxels that had significantly different higher FA in the control group. The clusters (highlighted in red) are superimposed on a structural T1 image (gray), and the skeletonized FA image (blue), Talairach coordinates (mm). (D) Bar chart showing the mean level of FA in each cluster for the expert (blue) and control groups (white).

