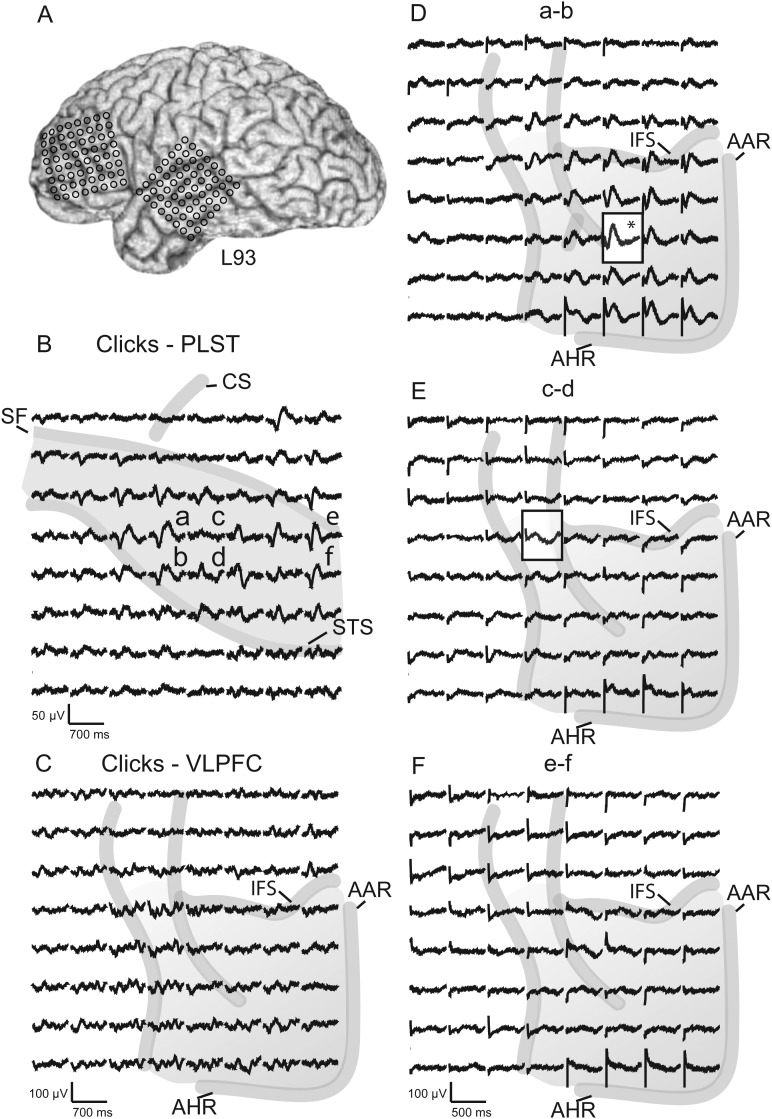
Figure 4.
(A) Lateral surface-rendered MR image showing locations of recording grids and response fields on STG and VLPFC of a left cerebral hemisphere. (B) Response fields on posterolateral STG to binaural click-train stimulation identify area PLST. Bipolar electrical stimulation of sites within PLST are identified by lower case letters a–f. (C) Response field on VLPF to the same click-train stimulus. (D–F) Response fields on VLPFC to electrical stimulation of three sites (a–b, c–d, e–f) on PLST. See legend of Figure 1 for further details.

