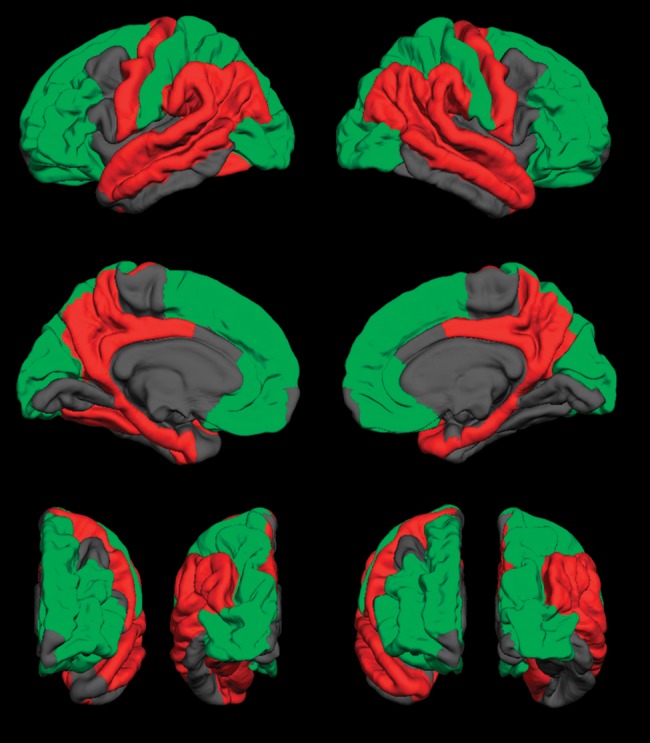
Figure 2.

Visual representation of group differences in cortical thickness. Green regions indicate thicker cortex in spina bifida myelomeningocele (SBM); red regions indicate thinner cortex in SBM; gray regions indicate no significant difference in thickness between SBM and typically developing groups. First row: lateral surface; second row: medial surface; bottom row: anterior (left) and posterior (right) surfaces of the left and right hemispheres, respectively. p< 0.05.
