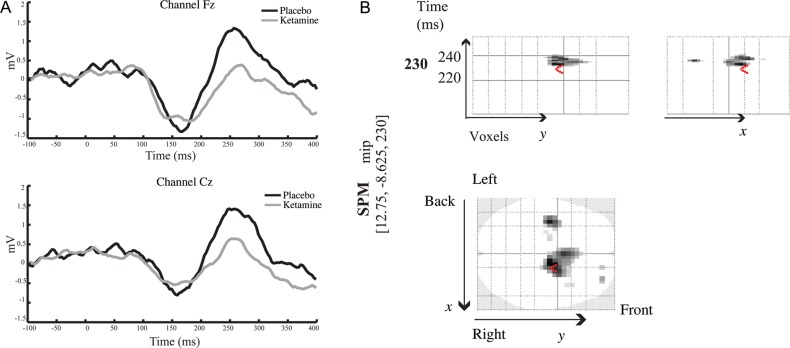
Figure 3.
(A) Grand average difference MMN waveform in placebo (black line) and ketamine (grey line) conditions across frontal and central electrodes. (B) Spatiotemporal representation of the effect of ketamine administration: Comparison of the MMN between placebo and ketamine conditions. SPM analysis was performed across all 64 channels and across the entire epoch [−100 400]. The SPM results show a significantly larger MMN in the placebo condition compared with the ketamine condition over frontal and central electrodes in the range of 220 and 240 ms, peaking at 230 ms.

