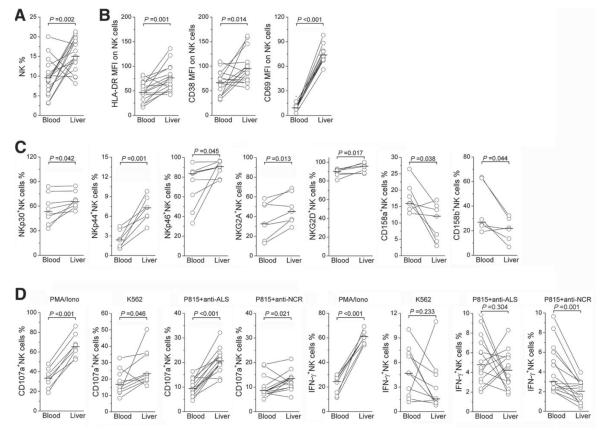
Fig. 7.
Direct comparison of NK cell activation status in intrahepatic and peripheral compartments in IA patients. The proportions of (A) NK cells, (B) NK subsets expressing activation markers HLA-DR, CD38, and CD69, and (C) NK cells expressing activation receptors NKp30, NKp44, NKp46, and NKG2D and inhibitory receptors NKG2A and CD158a/CD158b were compared in IA patients with paired liver and blood samples. (D) The proportions of NK cells producing CD107a and IFN-γ under various stimulations are also shown. Each dot represents one individual. P values are shown.

