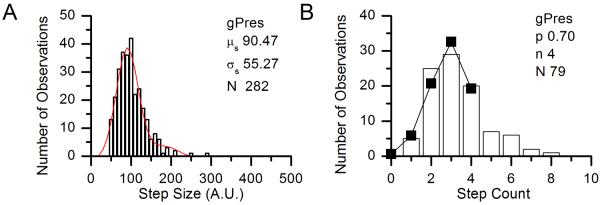
Figure 3.

Histograms of step size (A, in arbitrary units) and step counts (B) for a representative experiment in the determination of p. In A, the Gaussian fit parameters are given on the figure. The solid line and points in B shows the predicted distribution of step counts assuming n = 4.
