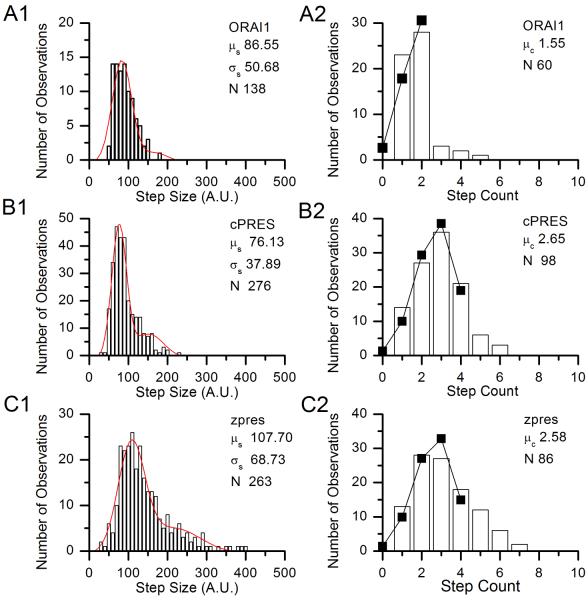
Figure 4.
Histograms of step size and step counts for single representative experiments in the determination of Slc26 stoichiometry. A) Histograms of step sizes (A1, in arbitrary units) and step counts (A2) from a single experiment on positive control ORAI1-eGFP. B) Histograms of step sizes (B1, in arbitrary units) and step counts (B2) from a single experiment on cPRES-eGFP. C) Histograms of step sizes (C1, in arbitrary units) and step counts (C2) from a single experiment on zpres-eGFP. The fit parameters for the step size distributions are given on the figures. In the step count histograms, the parameters show are the distribution mean μc and the number of points analyzed N. The solid lines and points show the predicted distribution of step counts assuming p = pest = 0.69 and n is the calculated integer value given in Table 2.

