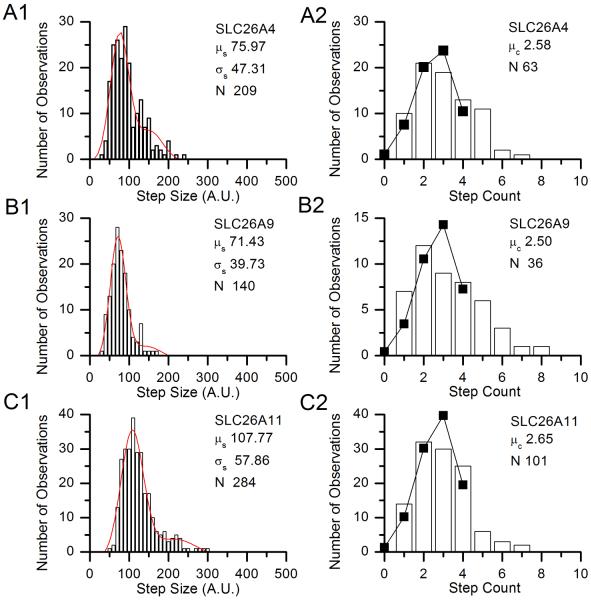
Figure 5.
Histograms of step size and step counts for single representative experiments on SLC26 paralogs. A) Histograms of step sizes (A1, in arbitrary units) and step counts (A2) from a single experiment on SLC26A4-eGFP. B) Histograms of step sizes (B1, in arbitrary units) and step counts (B2) from a single experiment on SLC26A9-eGFP eGFP. C) Histograms of step sizes (C1, in arbitrary units) and step counts (C2) from a single experiment on SLC26A11-eGFP eGFP. The fit parameters for the step size distributions are given on the figures. In the step count histograms, the parameters show are the distribution mean μ>c and the number of points analyzed N. The solid lines and points show the predicted distribution of step counts assuming p = pest = 0.69 and n is the calculated integer value given in Table 2.

