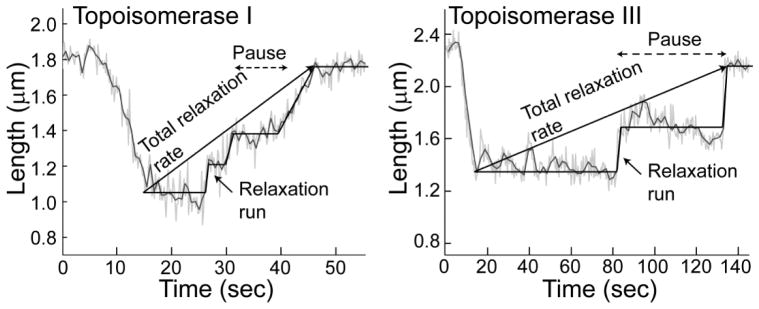
Figure 3. Single molecule relaxation by E. coli topoisomerases I and III.

The diagrams show typical relaxation experiments by either topoisomerase I or III (40). In the experiments, the length of the DNA molecule is directly related to the superhelical state of the DNA. In both cases, the enzymes relax DNA using a combination of relaxation runs preceded by pauses. In the case of topoisomerase I, the pauses are short and the relaxation runs are slow. Topoisomerase III behaves the opposite way, the pauses are long and the relaxation runs are fast. The combination of these two general features results in topoisomerase I having a faster overall relaxation rate than topoisomerase III, consistent with bulk experiments. Note the different time scales in the two diagrams. The straight lines overlaying the events serve as guides and do not represent actual fits.
