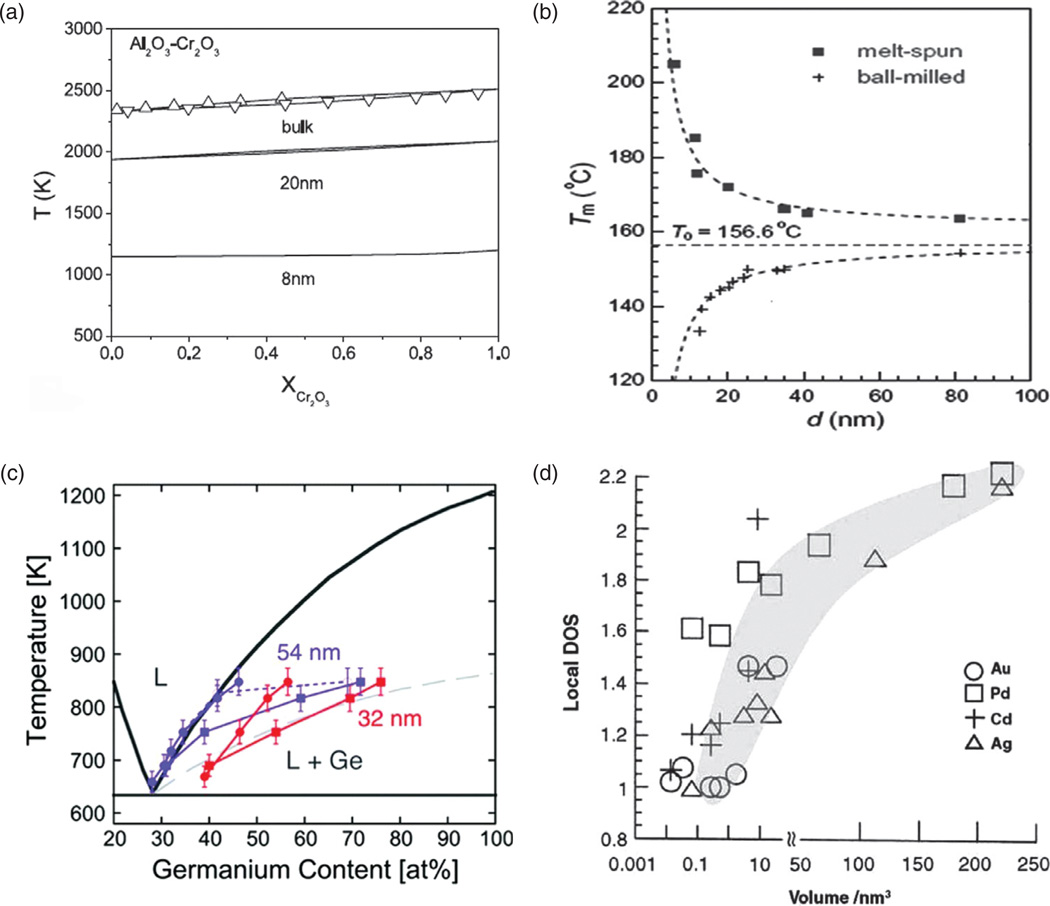
Figure 3.
(a) The melting point of Al2O3-Cr2O3 alloy as a function of Cr2O3 content and the particle size; (b) the melting point of indium as a function of the particle size for two different preparation procedures; (c) the phase diagram for a germanium-based alloy and two different particle sizes—54 and 32 nm; (d) local density of states, a measure of the band gap, decreasing in direct proportion to the particle volume and indicating a metal-insulator transition atV≈ 0.01–1 nm3 in case of three different metals: Au, Cd and Ag, but not Pd. Reprinted with permissions from [6], L. H. Liang, et al., Size-dependent continuous binary solution phase diagram. Nanotech. 14, 438 (2003). © 2003, IOP Publishing; From [7], K. Lu and Z. H. Jin, Melting and superheating of low-dimensional materials. Curr. Op. Solid State Mat. Sci. 5, 39 (2001). © 2001, Elsevier; From [8], E. A. Sutter and P. W. Sutter, Size-dependent phase diagram of nanoscale alloy drops used in vapor-liquid-solid growth of semiconductor nanowires. ACS Nano 4, 4943 (2010). © 2010, American Chemical Society.

