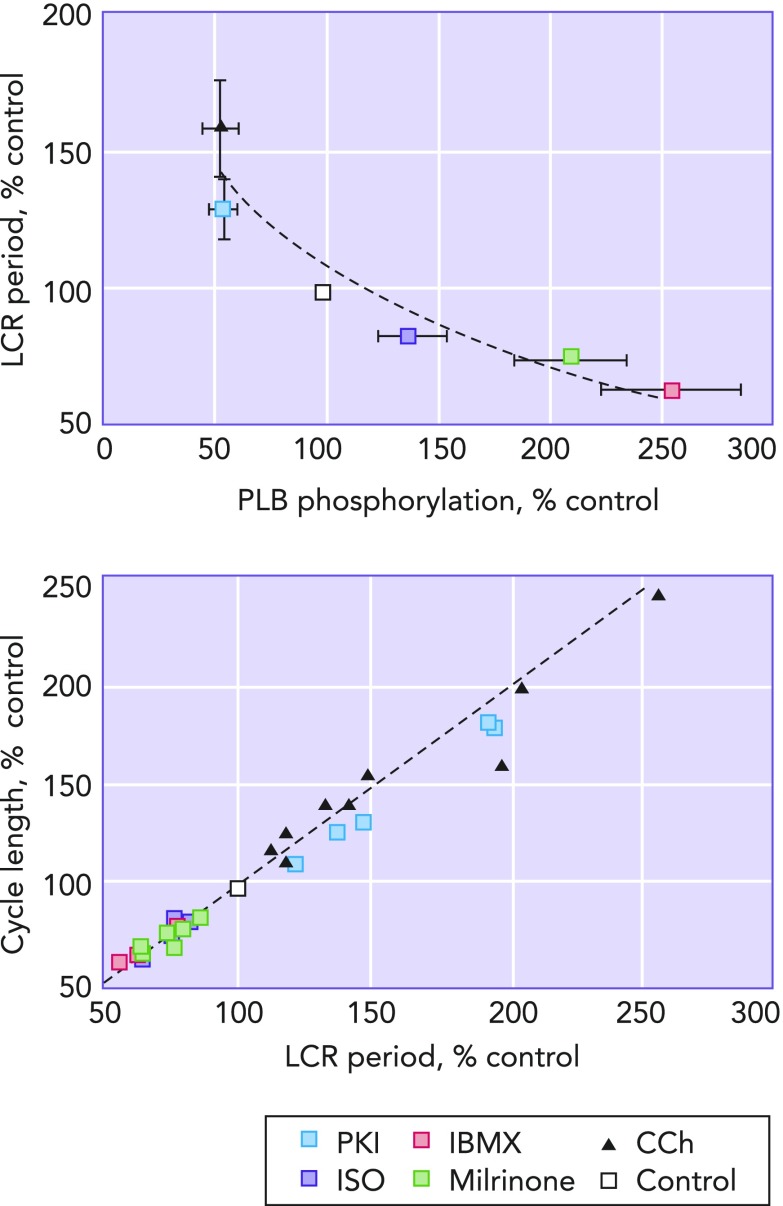
FIGURE 8.
LCR period as the master integrated function of the coupled clock system
Left: the relationship between the amount of phospholamban phosphorylation compared to control and LCR period. It can clearly be seen that decreasing the amount of phospholamban phophorylation relative to that present at control (white square) increases LCR period, and, vice-versa, increasing phospholamban phosphorylation relative to control decreases LCR period. Right: a clear and linear relationship passing through the origin between LCR period and cycle length is shown. Image is adapted from Ref. 35 and used per Circulation Research's permissions policy.

