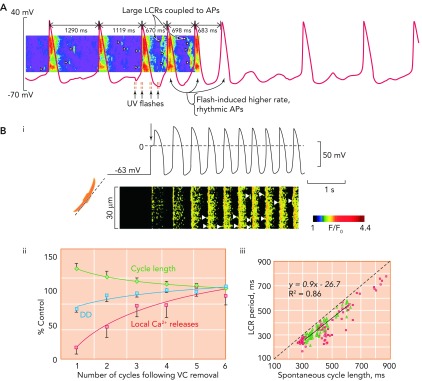
FIGURE 9.
The critical relationship between local Ca2+ release period and cycle length
A: exposure of rabbit SANC to a caged Ca2+ buffer causes progressive uncoupling of the tight relationship between LCR period and CL. Note the two long cycles at the start of the trace where LCRs (arrow heads) appear to be randomly scattered between action potentials, which occur at an abnormally slow rate. With UV flashes, Ca2+ is released from the caged buffer, and there is a temporary return to rhythmical, more rapidly occurring action potentials, with large and well organized LCRs occurring in the period befopre the upstroke of the action potential. Gradually, the effect of the flash fades, and the Ca2+ is once more taken up by the buffer, with a return to slower, more irregular action potentials. Image is from Ref. 77 and used with permission from Physiological Reviews. B: Bi shows simultaneous recordings of membrane potential (top) and confocal linescan measured Ca2+ fluorescence (bottom) in a SANC that is acutely released from voltage clamp at −65 mV. The arrow shows the exact moment of release of voltage clamp. It can crudely be seen that there is a progressive increase in beating rate, with a beat-to-beat recovery in LCR signal mass. Bii demonstrates the mean rate of recovery of local Ca2+ releases (red squares), cycle length (green diamonds), and diastolic depolarization rate (blue circles) in 5 SANC following acute release of voltage clamp. There is a high degree of correlation between recovery of LCRs and both increasing rate of diastolic depolarization rate (r2 = 0.78) and decrease in CL (r2 = 0.92). Biii demonstrates the close relationship between LCR period and CL following release of voltage clamp (green triangles). This data is compared with data concerning the relationship between LCR period and CL during spontaneous beating (red squares). Image is from Ref. 69 and used with permission from Biophysical Journal.

