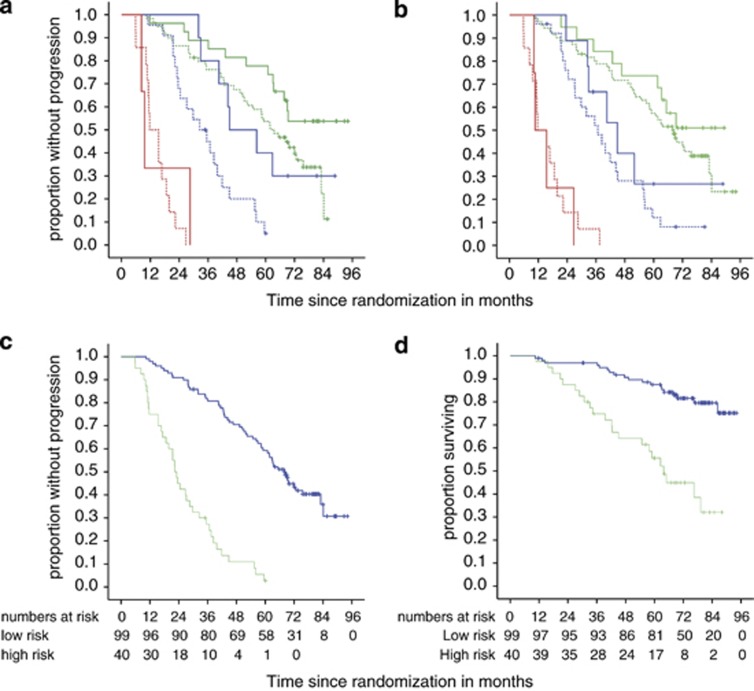
Figure 1.
Combination of individual risk features to predict PFS and OS after FCR treatment. MRD levels are grouped as high (red curves, ⩾10−2), intermediate (blue curves, ⩾10−4 to<10−2) and low (green curves, <10−4) in (a, b). Patients classified as high and low risk by the algorithm are symbolized using green and blue curves, respectively, in (c, d). (a) PFS by MRD levels and IGHV status (n=135). For patients who attained intermediate MRD levels, a mutated IGHV (solid lines) was associated with longer PFS compared with patients with unmutated IGHV (dashed lines) status (HR 3.2, P=0.02, n=32). IGHV had a lesser impact on PFS in high-level MRD (HR 1.6, P=0.56, n=17) and low-level MRD patients (HR 1.9, P=0.046, n=86). (b) PFS by MRD levels in female (solid curves) and male (dashed curves) patients (total n=143), showing a marginally, but not significantly better outcome in women who achieved intermediate (n=35, HR 0.62 P=0.30,) and low-level MRD (n=90, HR 0.69, P=0.29), while no difference at all was detectable in high-level MRD patients (n=18, HR 1.2, P=0.8). (c) PFS in patients classified as high and low risk by the algorithm (HR 6.6, P<0.001). (d) OS in patients classified as high and low risk by the algorithm (HR 4.4, P<0.001).

