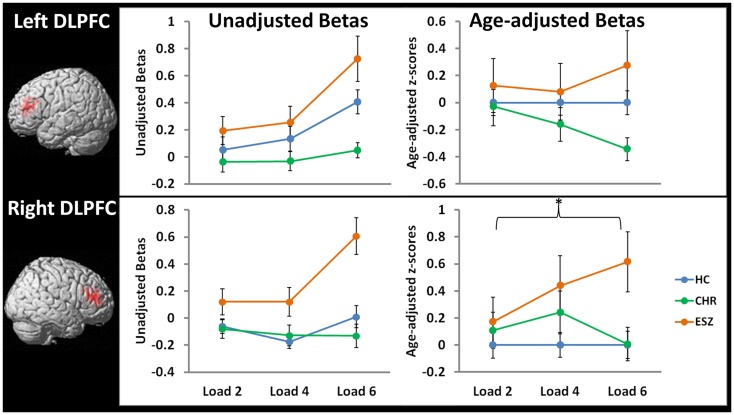
Figure 5.
Line graphs display mean fMRI contrast value (±standard error) for left and right DLPFC regions-of-interest by Group, for low (two-item), medium (four-item), and high (six-item) working memory loads during the probe condition. Unadjusted (left) and age-adjusted (right) data are shown in figure panels.°
°Statistical tests of age-adjusted extracted fMRI data (*p < 0.05): data were adjusted for participant age via a z-scoring procedure based on an age regression within the HC group to model normal aging effects. As a result, for each voxel in the brain, the age-adjusted z-scores in the HC group have a mean = 0; SD = 1, and the means in the patient groups reflect the degree and direction of abnormality, in standard units, from the HC-derived age-specific norms.
rmANOVA left DLPFC ROI, main effect of group: F(2, 105) = 2.10, p = 0.13
rmANOVA left DLPFC ROI, interaction effect of group-by-load: F(4, 210) = 1.37, p = 0.25
*rmANOVA right DLPFC ROI, main effect of group: F(2, 105) = 3.58, p = 0.03; Tukey–Kramer HSD post hoc tests, collapsed across load, HC < ESZ, p = 0.02
rmANOVA right DLPFC ROI, interaction effect of group-by-load: F(4, 210) = 1.64, p = 0.17

