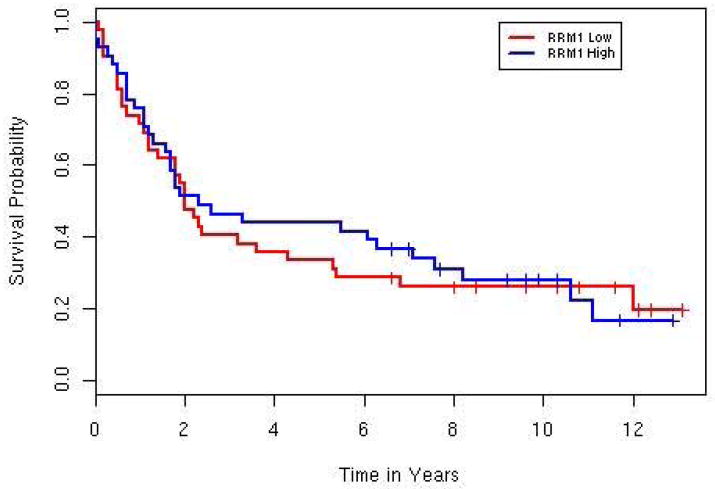
Figure 2. Overall survival curves for RRM1 expression, high versus low, for the entire cohort.
No significant difference in survival between high and low RRM1 expressors was observed (2.1 vs. 2.0 years, p=0.81). The median OS was calculated with censored observations, which are denoted as “pluses” in the figure.

