Figure 3.
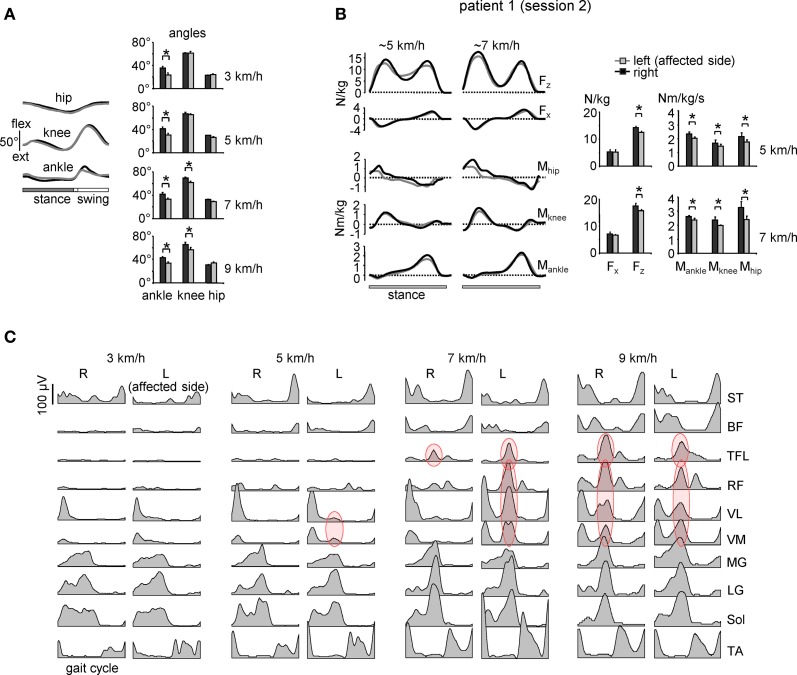
Motor patterns in a patient with sciatic nerve compression [the same patient as in Figure 2A but recorded 1 year later (session 2)]. (A) ensemble-averaged (across 12 consecutive steps) joint angular displacements (left panel, mean ± SD) and amplitudes of angular joint motion (right panel) during walking at 3 km/h. Asterisks denote significant differences. Note significantly smaller distal joint oscillations on the affected (left) side. (B) ensemble-averaged (n = 5 steps) vertical (Fz) and horizontal anterior-posterior (Fx) ground reaction forces, and ankle, knee and hip joint moments of force normalized to the patient's weight during overground walking at ~5 and 7 km/h in session 2 (left panels). The patterns are plotted vs. normalized stance. On the right—peak-to-peak amplitudes. (C) Ensemble-averaged bilateral EMG activity of leg muscles during walking on a treadmill at different speeds. In session 1 (Figure 2A), the patient could walk only at speeds up to 5 km/h due to plantarflexor weakness, while in session 2 we recorded walking in a wide range of speeds (3–9 km/h). Adapted from Ivanenko et al. (2013a). Note a prominent burst of activity (marked in red) in the proximal extensors during late stance on the affected (left) side at low speeds in the session 1 (Figure 2A) and only at higher speeds (>5 km/h) in session 2. Furthermore, at 9 km/h the “atypical” burst of activity was present in both legs, as in healthy subjects (see Figure 1A).

