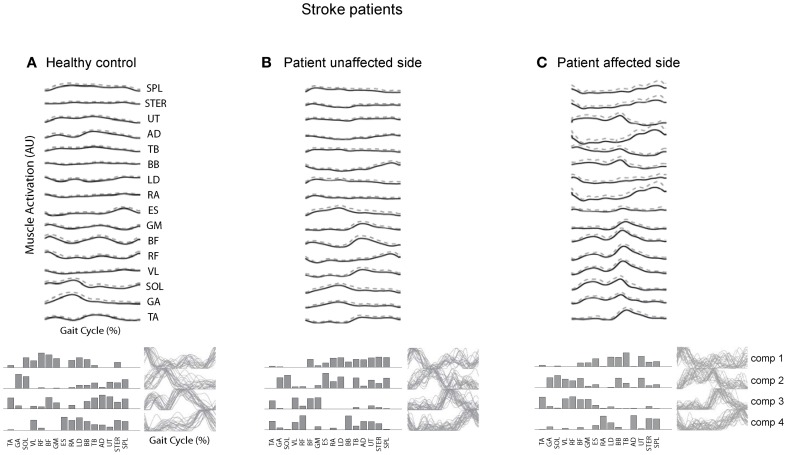
Figure 5.
Surface electromyogram (means and SD), motor modules (bottom, left), and activation signals (bottom, right) for a representative healthy control subject (A) and for the unaffected (B) and affected side of a stroke patient. (C) Adapted from Gizzi et al. (2011).

