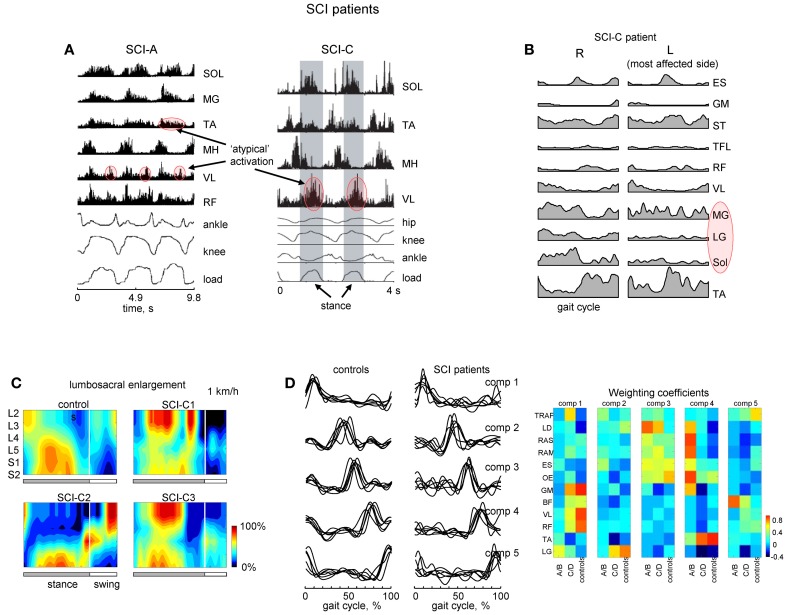
Figure 6.
Motor patterns in SCI patients. (A) An example of weight-bearing stepping in a clinically complete (at 0.22 m/s, left panel) and incomplete (at 0.89 m/s, right panel) SCI individuals [modified from Beres-Jones and Harkema (2004) and Maegele et al. (2002) with permission of the authors]. The stance phase in the right panel is evidenced by the elevation in the ground reaction force trace and indicated by the shaded region. MH, medial hamstring; load, vertical ground reaction force. (B) Ensemble-averaged (across 5 strides) EMG patterns in the SCI-C patient during walking at a natural speed (~3.1 km/h). Note variable and weaker muscle activity on the most affected side (marked in red). (C) Examples of spatiotemporal patterns of α-motorneuron activity in the lumbosacral enlargement in controls and three SCI-C patients during walking on a treadmill at 1 km/h. Output pattern for each segment was reconstructed by mapping the recorded EMG waveforms (normalized method, see Ivanenko et al., 2006) onto the known charts of segmental localization. White vertical lines denote stance-to-swing transition time. (D) Time course of the temporal components in controls and patients for stepping at 2 km/h, 0–75% body weight support. The components extracted by factor analysis from individual subjects. Right panel illustrates weighting coefficients of the temporal components in individual activity patterns of 12 muscles for all groups of subjects in a color coded scale. Adapted from Ivanenko et al. (2003). Note similar basic EMG components in controls and patients as opposed to quite different EMG patterns and weighting coefficients.

