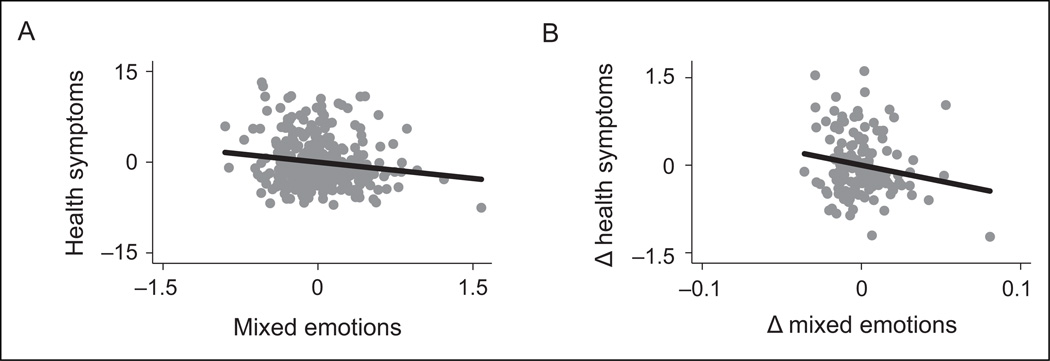
Figure 1.
Partial plots showing relationship between mixed emotions and physical health symptoms, controlling for age, positive emotions, and negative emotions. (A) Average mixed emotions (Fisher’s r-to-z transformation of Pearson’s r correlation between aggregates of positive and negative emotions) are negatively associated with average physical health symptoms. (B) Changes in mixed emotions over time (hierarchical linear modeling [HLM] coefficient indicating change in mixed emotions over waves of participation) are negatively associated with changes in health symptoms over time (HLM coefficient indicating change in health symptoms over waves of participation).

