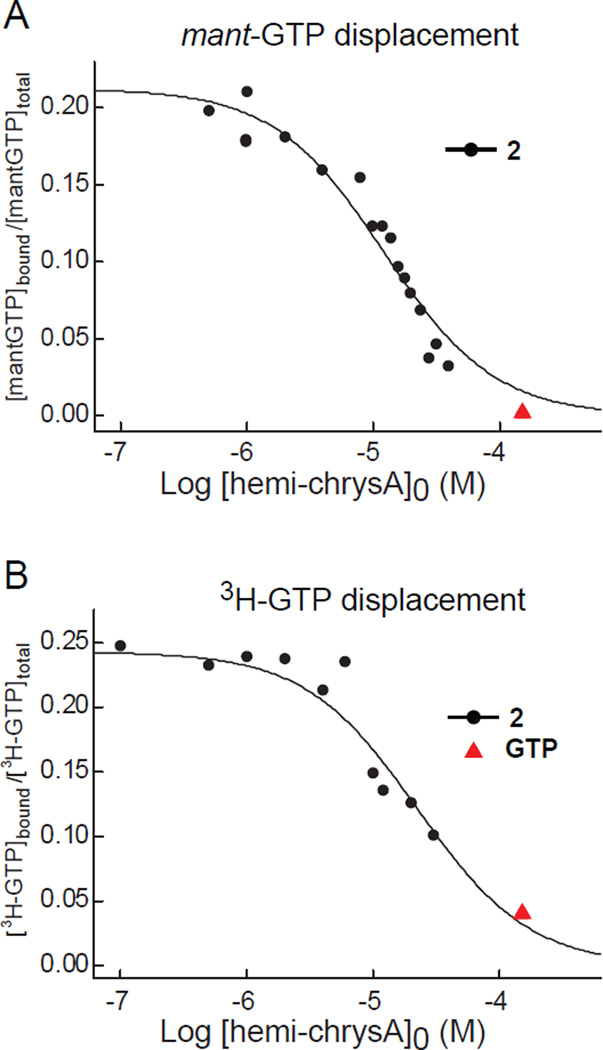
Figure 2.
Hemi-chrysophaentin 2 is a competitive inhibitor of FtsZ. (A) Curve showing the concentration dependent displacement of the fluorescent nucleotide mant-GTP (500 nM) by compound 2 in B. subtilis FtsZ (380 nM). Displacement is measured by the change in fluorescence anisotropy. The solid line represents the least squares best fit to the data (black circles) using a simple competition model.17 Control showing displacement of mant-GTP by GTP (150 µM) is included (red triangle). (B) Curve showing displacement of 3H-GTP (100 nM) from FtsZ (70 nM) by 2, determined by co-sedimentation and scintillation counting of 3H-GTP-bound FtsZ. The solid line shows the best fit to the data.

