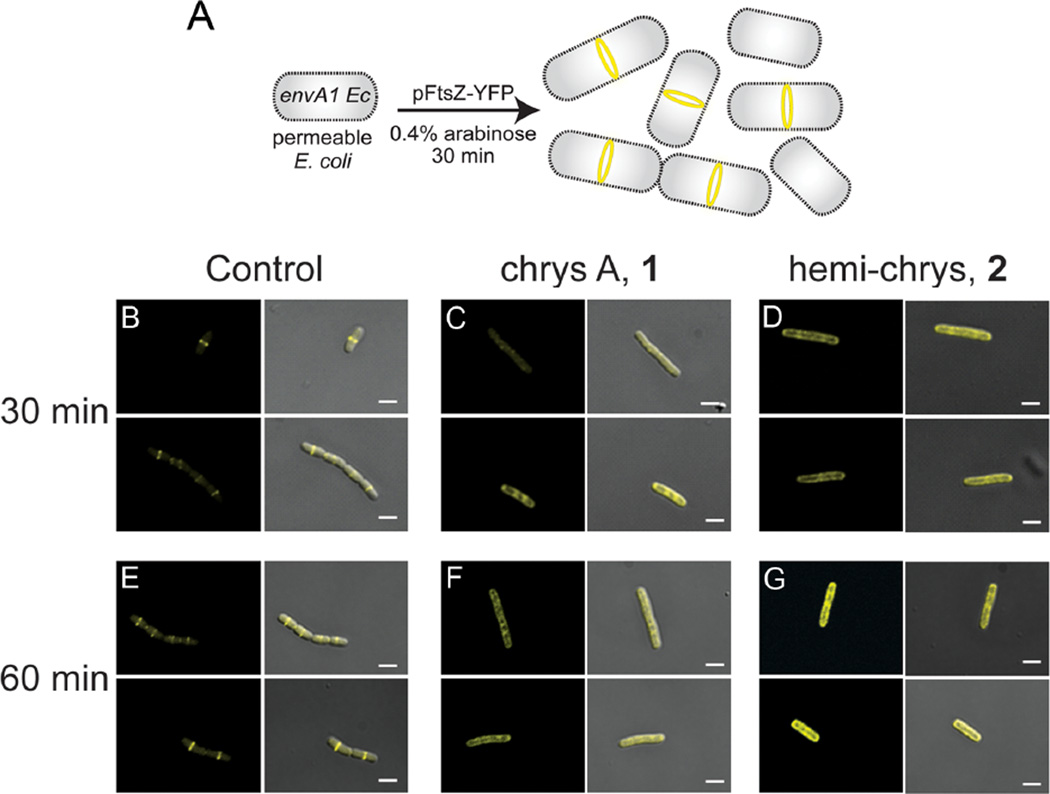
Figure 3.
Effects of chrysophaentins on Z-ring structure using fluorescence microscopy of envA1 E. coli/FtsZ-YFP. For each panel, micrographs showing fluorescence alone (ex 488, em 558) is shown on the left, and fluorescence merged with differential interference contrast (DIC) is shown on the right. Duplicate representative images of each experimental condition (including controls and inhibitor treatments at two time points) are shown. All images were acquired with a 100× lens; white scale bars, 2 µm. (A) Schematic showing the system used for visualizing fluorescent Z-rings in envA1/pFtsZ-YFP. Bacterial cells at different stages of cell division are present, as depicted in the cartoon. Microscopy showing treatment of envA1/pFtsZ-YFP with (B) 1% MeOH, 30 min; (C) 125 µM 1 in 1% MeOH, 30 min; (D) 340 µM 2 in 1% MeOH, 30 min; (E) 1% MeOH, 60 min; (F) 125 µM 1 in 1% MeOH, 60 min; (G) 340 µM 2 in 1% MeOH, 60 min. Micrographs taken at lower magnification that show numerous bacteria in a given field are available in Ref. 23.

