
Figure 1. Appearance of central atrophy and pisciform flecks in Stargardt disease on color fundus photography and autofluoresence imaging of patient #1.
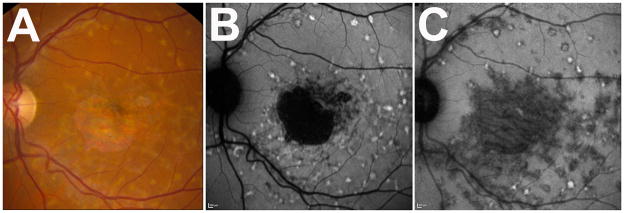
(A) Color fundus photograph (CFP) demonstrating typical yellow flecked lesions throughout macula and a central area of retinal and RPE atrophy. (B) Same fundus imaged with autofluoresence imaging with excitation at 488nm (FAF), demonstrating a defined area of sharply demarcated hypoautofluorescence, indicating an area of RPE loss Additional areas of mottled hypoautofluorescence in parafovea were observed adjacent to the central area of atrophy. Hyperautoflurorescent flecks in concentric patterns are found extending out from center macula. (C) Same fundus imaged with autofluoresence imaging with excitation at 795nm (NIA), demonstrating more diffuse and widespread abnormalities than seen on CFP or FAF. There are proportionally more hypoautofluorescent flecks than hyperautofluorescent flecks.