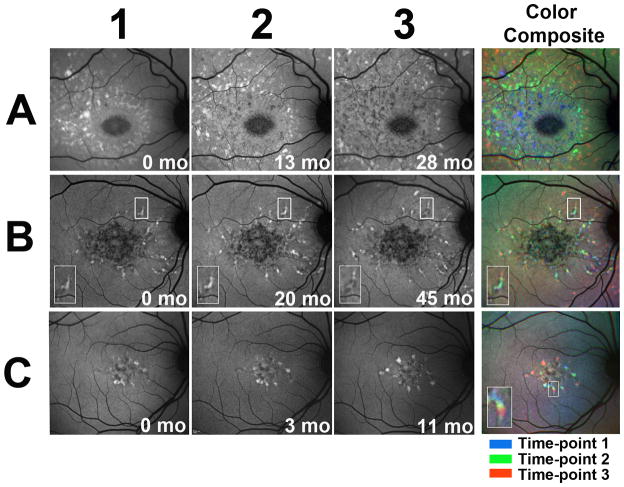
Figure 3. Longitudinal changes in fundus autofluorescence of fleck lesions in Stargardt disease captured using 488 nm excitation (FAF).
Autofluorescence images of 3 Stargardt patients (A= patient # 2, B=patient #3 and C=patient #4) with fleck lesions captured on FAF imaging. (A) Spread of hyperautofluorescent fleck lesions in a centrifugal “wave” centered on the fovea. Numbers (1,2,3) indicate separate time-points during follow-up. Color composite that superimposes all 3 images as color-coded layers (right) demonstrates the progressive outward spread. (B) Hyperautofluorescent flecks can be seen extending contiguously as trails in a center-to-peripheral direction. Insets contain magnified views of one representative fleck (box); the fleck can be observed to progress with a hyperautofluorescent leading edge, leaving behing a hypoautofluorescent trailing edge. Color composite demonstrates fleck progression. (C) A similar example of contiguous fleck progression as seen in (B). Inset in C represents a magnified view of one fleck as it extended contiguously over time (box); Color composite key: blue = time-point 1, green = time-point 2, red, time-point 3.

