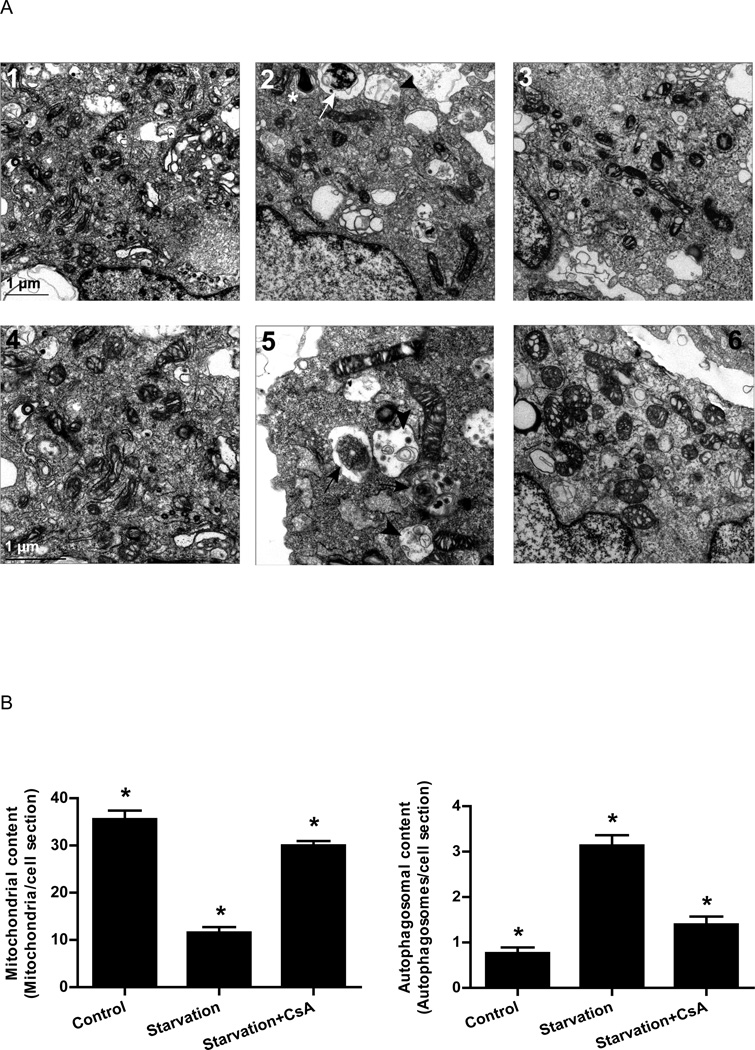
Figure 7. Cyclosporin A prevented starvation-induced decrease in mitochondrial content and increase in autophagosome formation.
A) Electron micrographs of HL-1 cells incubated in: 1 and 4) Claycomb media; 2 and 5) starvation media; 3 and 6) starvation media supplemented with 5 µM CsA. Images 1, 2 and 3 are the same magnification. Images 4, 5 and 6 are higher magnification for better visualization of structures. Phagophores (*), autophagosomes (white arrow) and autolysosomes (black arrowhead) were observed in cells subjected to starvation. Black arrows indicate autophagosomes and black arrowheads indicate autolysosomal vesicles. B) Quantification of mitochondria and autophagosomes in thin slices from 30 different cells per experimental condition. * p < 0.05.

