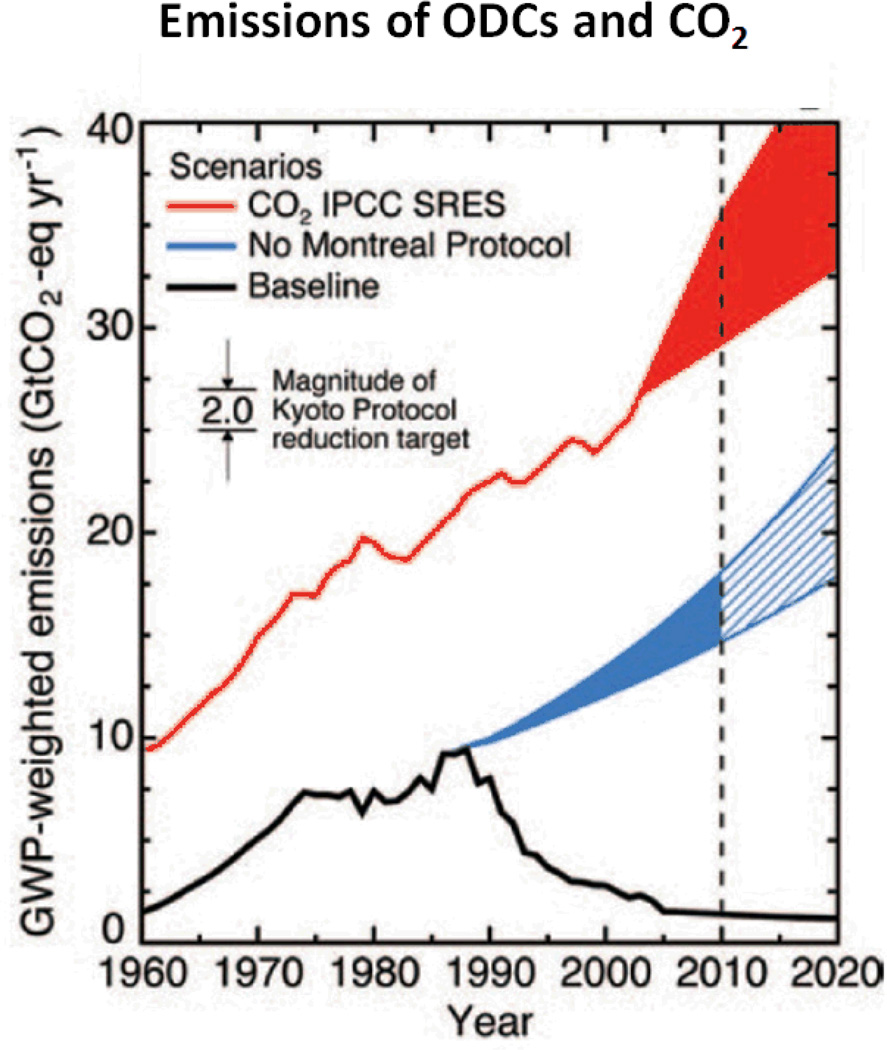
Figure 1.
Graph of the global warming potential of industrial sourced ozone depleting chemicals (ODCs) and emissions in the atmosphere. Blue area shows the projection in the absence of the Montreal Protocol. The Red line and red shared area projects carbon dioxide emissions. Dashed black line indicates Kyoto Protocol Target Evaluation Period. Abbreviations; IPCC (International Panel on Climate change), SRES (Special Report on Emission Standards), GWP (Global Warming Potential), GtCO2 (Gigatonne carbon dioxide equivelant). (Figure published in (19) Solomon and Chanin 2011).

