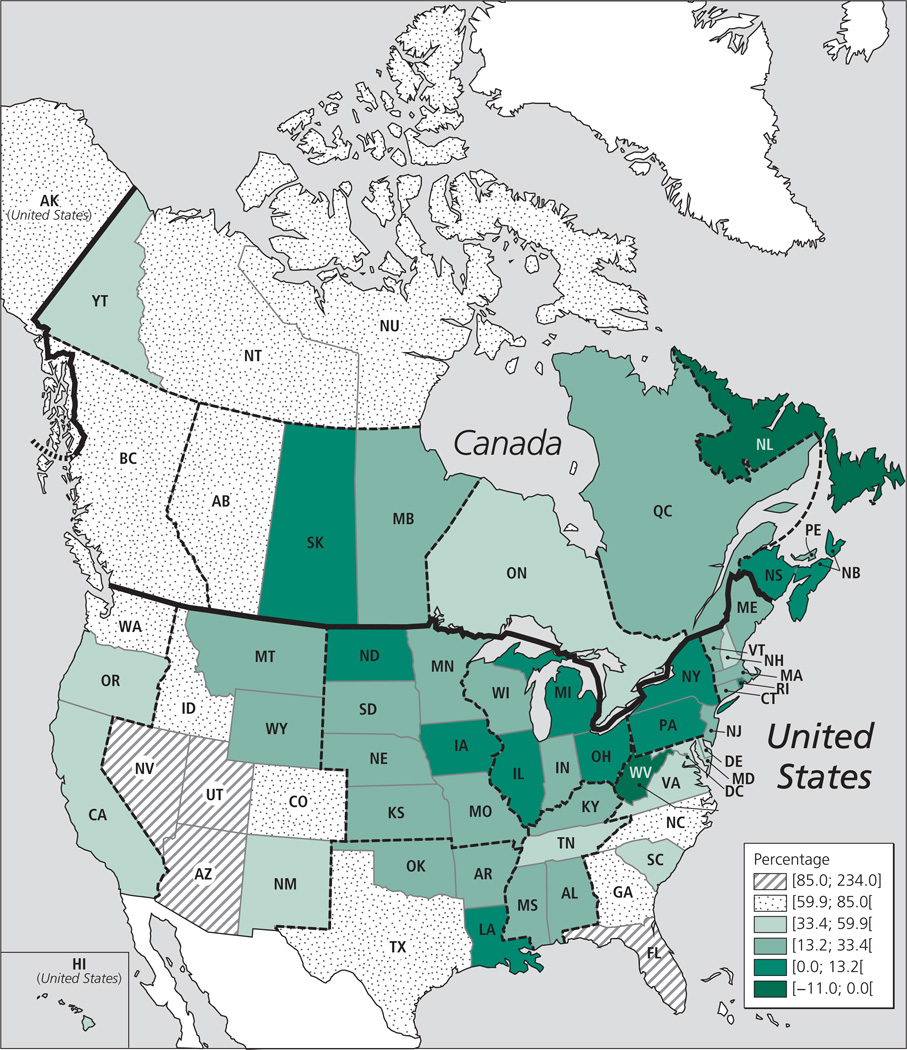
Figure 3.
Relative population growth (%) of Canadian provinces and territories and American states from 1980 to 2010*
Note: On this map and the following ones, the class intervals were determined using the classification method developed by Fisher (1958) and applied in the R software environment. Inflection points are identified in order to group data in a way which minimizes differences between values within each class while maximizing the variation between classes.
* Period from 1 July 1980 to 30 June 2010.
Sources: Canada: Statistics Canada, CANSIM database, Table 051-0001. United States: 1980: United States Census Bureau, Table for “Resident Population of States” published in August 1995; 2010: United States Census Bureau, Table ST-EST00INT-ALLDATA published in September 2011.

