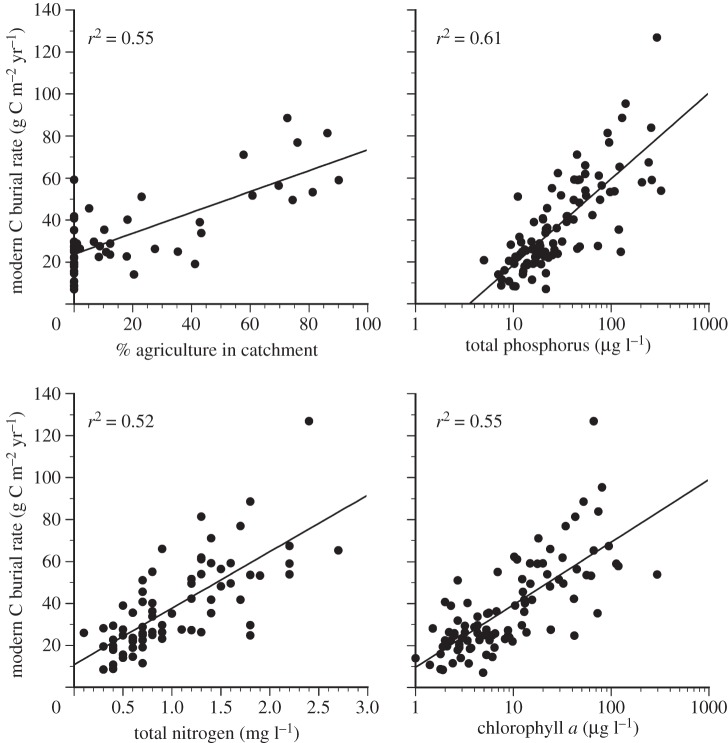
Figure 3.
Relationships between contemporary C accumulation rates (g C m–2 yr–1) and selected limnological variables (total phosphorus, total nitrogen and chlorophyll a; n = 97, 74 (after three extreme outliers being removed) and 95, respectively; see Material and methods for data sources) and percentage agricultural land-use in catchment (n = 52; see [12]).

