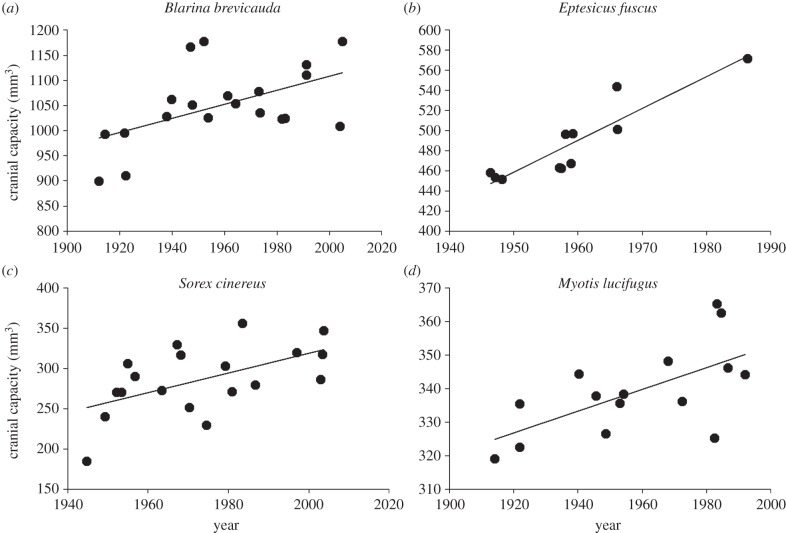
Figure 3.
Changes in cranial capacity over time in rural populations. Shown are leverage plots from ANOVAs that included body size (the first principal component of a PCA on total body length, tail length and hindfoot length, run separately for each species) and year, run separately for each species and population (table 2).

