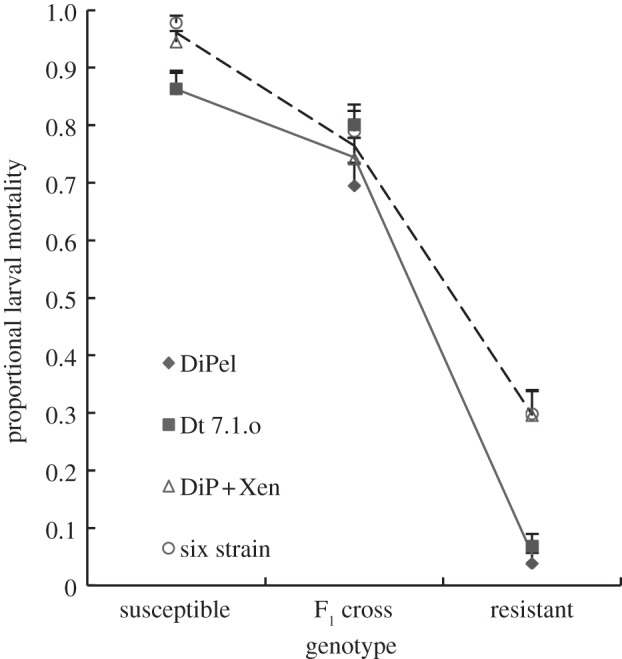
Figure 3.

Mortality and dominance of resistance after exposure to the single- and mixed-strain applications used in the whole plant selection experiment. Data are mean mortality + s.e.s calculated from six independent plants (N ≅ 130 insects in total per treatment). The lines are the minimal adequate statistical models fitted to the observed mortality data: the solid line represents the mixed-strain treatments, the dashed lines the single-strain treatments. Open symbols are single-strain data, filled symbols are mixtures containing wild-type bacteria.
