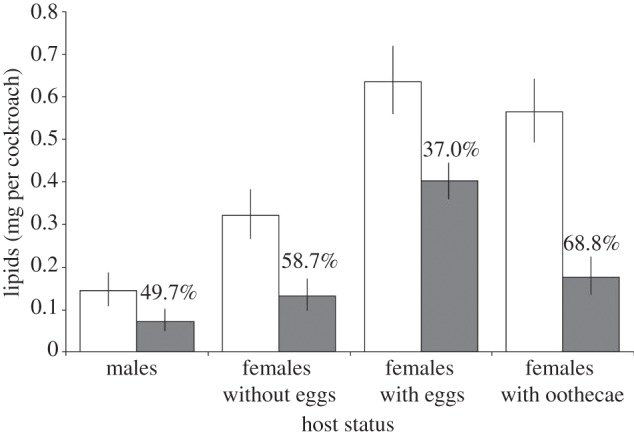
Figure 2.

GLM predicted lipid levels (mg) from Gregarina blattarum uninfected (open bars) and infected (filled bars) colonies, for each host status group. Error bars denote 95% confidence intervals (CIs) of the predictions. Values above the bars represent the percentage reduction in lipids between hosts from the infected and uninfected colonies.
