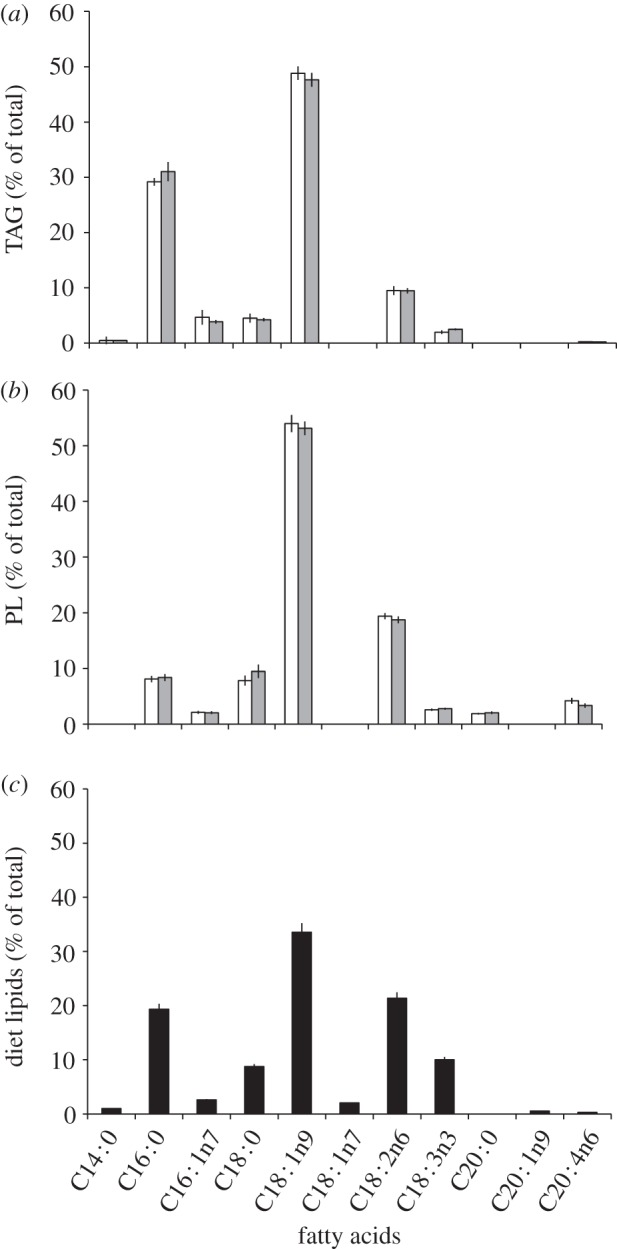
Figure 3.

The mean fatty acid profiles of (a) TAG and (b) polar lipids (PL) from G. blattarum uninfected (open bars) and infected (grey bars), and (c) the total fatty acid profile from host diet (black columns). Error bars denote 95% CIs. Shorthand nomenclature for the fatty acids is shown with the number before the colon indicating the number of carbons and the figure after representing the number of double bonds. The position of the first double bond is also shown as the number after the n.
