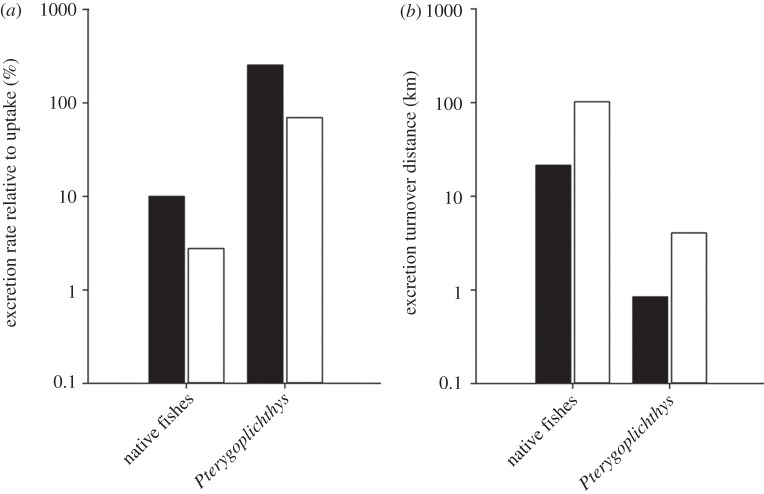
Figure 3.
(a) Nutrient excretion rate relative to stream nutrient uptake (%) over a 100 m reach in the Chacamax River. (b) Excretion turnover distance (in kilometres) by loricariids and native fishes in the Chacamax River. Note the y-axes are on log scales. Black bars denote NH4+ and white bars denote SRP.

