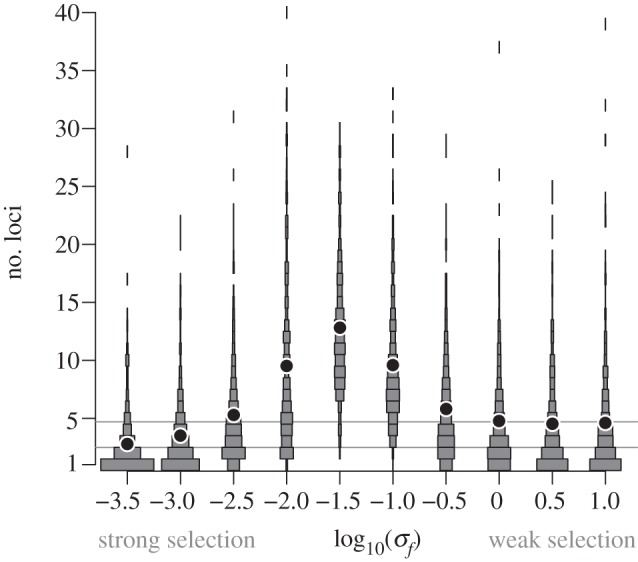
Figure 1.

The genetic architecture underlying a trait depends on the strength of selection on the trait, in a population-genetic model. Traits subject to intermediate selection (intermediate values of σf) evolve genetic architectures with the greatest number of controlling loci. Dots denote the mean number of loci in the architecture underlying a trait, among 500 replicate Wright–Fisher simulations, for each value of the selection pressure σf. The rectangular areas represent the distribution of the number of loci in the architecture. The neutral expectations for the equilibrium number of loci (see Methods) are represented as grey lines, when recruitment events are neutral (top line) or not (bottom line). Parameters are set to their default values (see electronic supplementary material, table S2).
