
Figure 1.
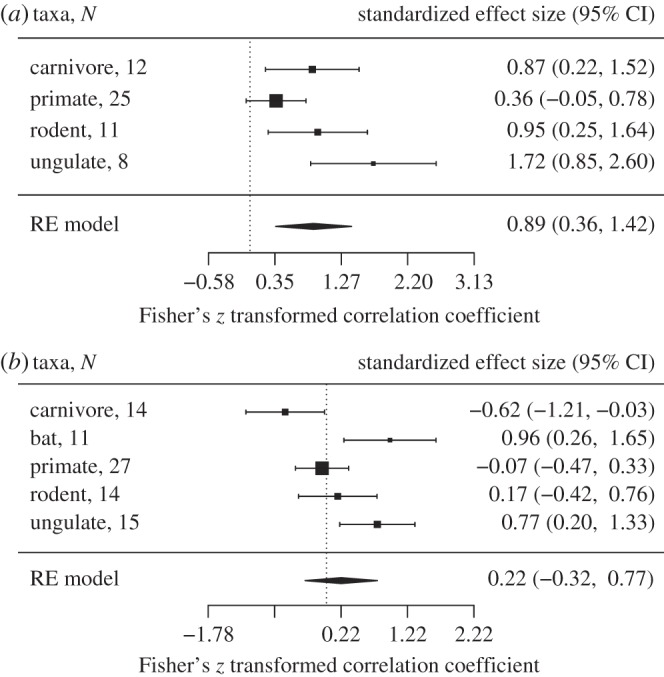
Forest plots showing predictors of the rate of non-synonymous substitutions (dN) at ABS. PGLS models show the effect of (a) relative testes size and (b) parasite richness, run separately for each mammal group. The vertical dotted line is positioned at zero and error bars denote 95% CIs. N refers to the number of species included; RE model, random effects model. Heterogeneity test for relative testes size: Q = 8.433, p = 0.038, I2 = 63.84%; parasite richness: Q = 17.408, p = 0.002, I2 = 79.06%.