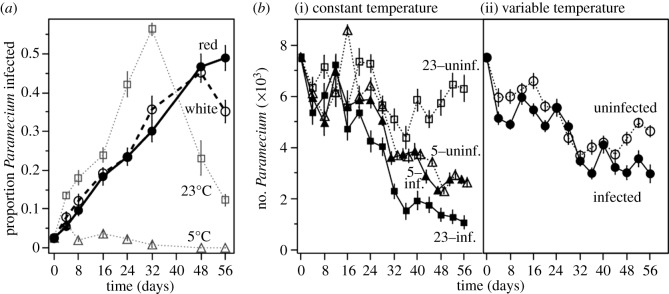
Figure 1.

(a) Mean (±s.e.) parasite infection prevalence in metapopulations, measured as mean proportion of Paramecium infected, in constant (5 and 23°C) and variable (red and white noise) temperature environments. (b) Mean Paramecium subpopulation sizes in infected (solid lines) and uninfected (dashed lines) metapopulations in (i) constant 5 and 23°C environments and (ii) variable temperature environments.
