
Figure 2.
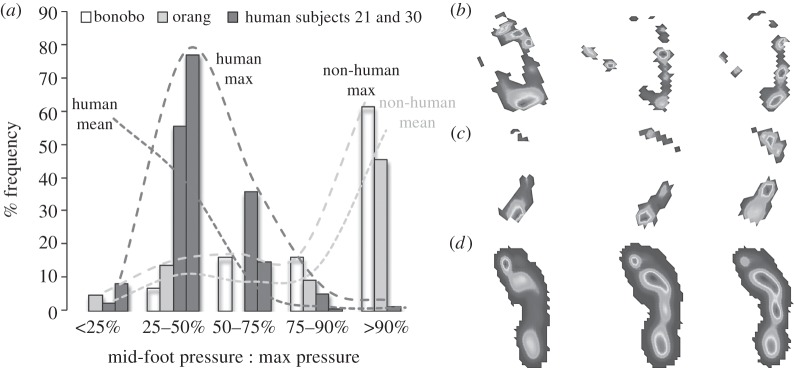
Comparison of relative mid-foot pressures in human and NHAs. (a) Plot showing the frequency distribution of footfalls categories based on mid-foot pressure as a percentage of overall peak pressure individual footfalls for the bonobo, orangutan and two human subjects (numbers 21 and 30 in electronic supplementary material 2) with relatively frequent occurrences of footfalls with high mid-foot pressures. Maximum lines represent the human and non-human subjects with the most extreme right skew to their mid-foot pressure distributions, whereas the mean lines represent the average frequency for each mid-foot pressure category in the full human and non-human datasets. (b–d) Mean plantar pressure records for (b) bonobos, (c) orangutans and (d) human subject 35 for the mid-foot pressure categories shown in (a) (left, mid-foot pressure less than 25% peak pressure; middle, mid-foot pressure 50–75% peak pressure; right, mid-foot pressure greater than 90% pressure peak).