
Figure 4.
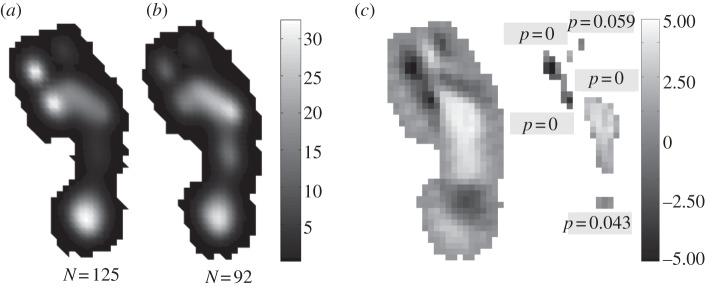
Topological statistical comparisons of peak plantar pressure records with a mid-foot pressure less than 25% peak pressure against those in which mid-foot pressure is greater than 50% overall peak pressure in a single human subject. (a) Mean peak plantar pressure for records with mid-foot pressures less than 25% peak pressure. (b) Mean peak plantar pressure for records with mid-foot pressures greater than 50% peak pressure. (c) Statistical parametric maps (SPM) showing areas of difference and levels of statistical significance between the means and their populations. In SPMs, lighter shades indicate areas of higher pressure in the ‘mid-foot pressure greater than 50% peak pressure’ category, whereas darker areas indicate relatively higher pressures in the ‘mid-foot pressure less than 25% peak pressure’ category.