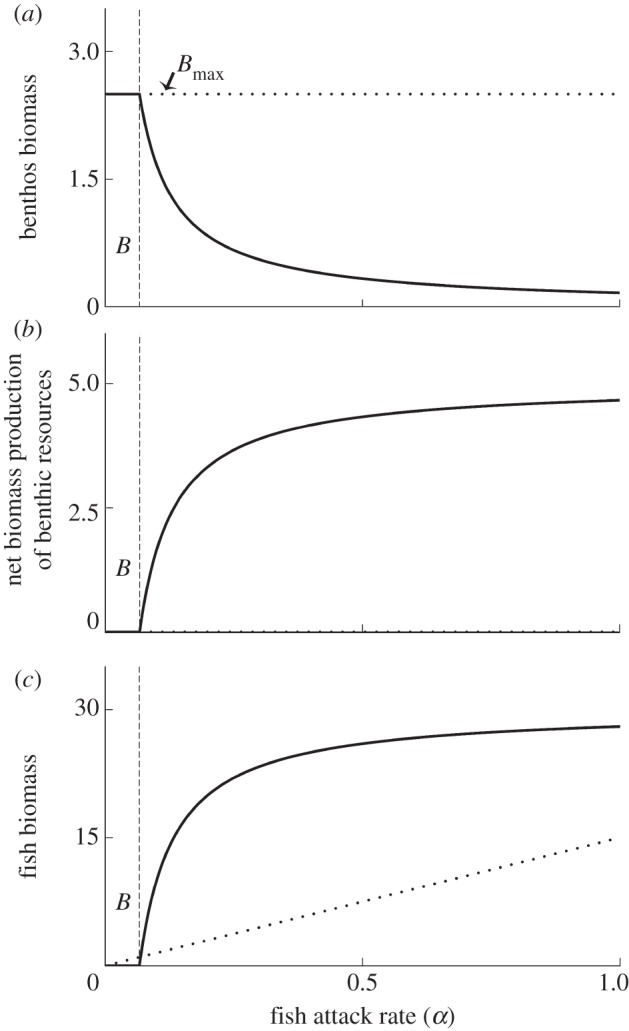
Figure 1.

(a) Benthos biomass, (b) net biomass production of benthic resources r(Bmax−(BS + BR)) + r(Bmax−(BR + BS)) and (c) fish biomass as function of the fish attack rate α (both (a) and (b) are the sum of BS and BR). The solid lines show model results when system is top-down controlled, whereas dotted lines show model outcome when system is bottom-up controlled (dotted line in (b) is at zero). At low values of α, fish cannot persist in a top-down controlled system (to the left of the vertical dashed lines). Higher values of α increase fish predation and this results in coexistence between both benthos and fish. B, persistence of benthos without fish. f = 0, m = 0, gBs and gBr are both 0.6, all other parameters have default values.
