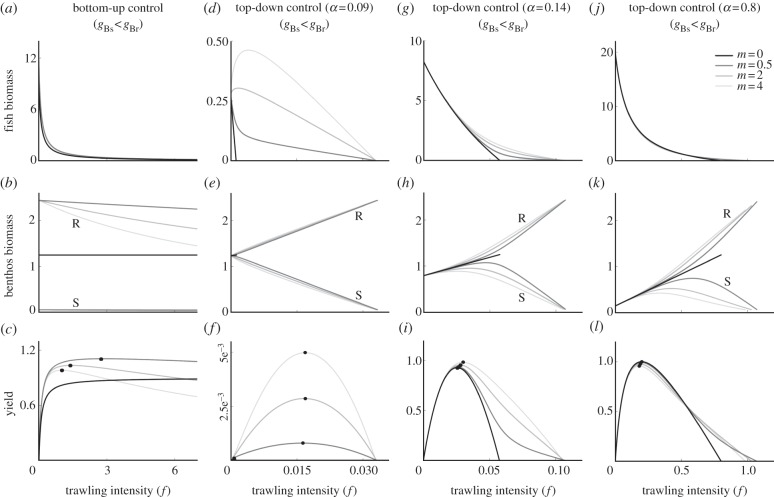
Figure 2.
Impact of bottom trawling (by varying f) on fish biomass, benthos biomass and yield, the product of the trawling intensity (f) and fish density, in a bottom-up controlled system (a–c) and three systems with various strengths of top-down control (d–f, α = 0.09; g–i, α = 0.14; j–l, α = 0.8). Resistant benthos are more profitable food for fish (gBs < gBr). The different grey coloured lines present different scaled trawling mortalities on benthos (m). Susceptible and resistant benthos (in b, e, h and k) have the same biomass levels at m = 0. All lines above this black line (m = 0) show biomass levels of resistant benthos (marked with R), whereas all lines below this black line show biomass levels of susceptible benthos (marked with S). The dots (in c, f, i and l) represent maximum sustainable yield levels. gBs = 0.3, gBr = 0.6, all other parameters have default values.

