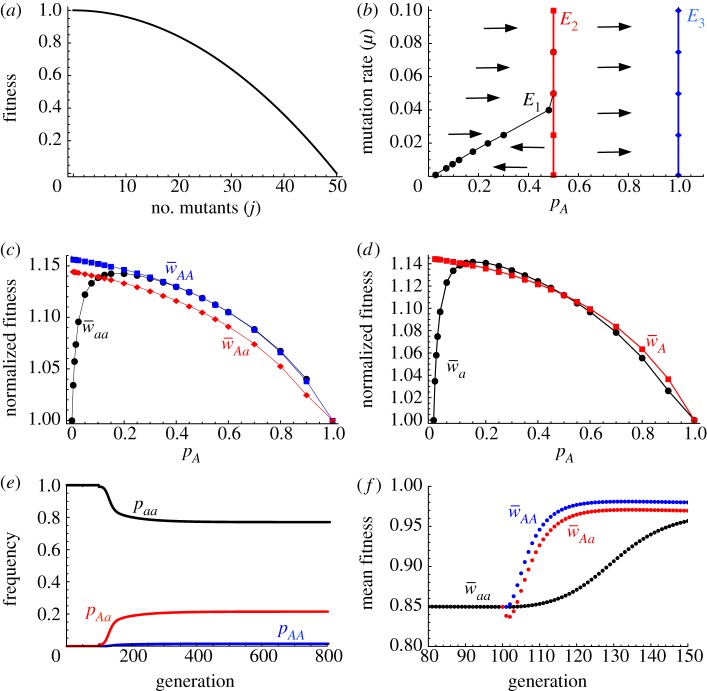
Figure 1.
(a) Concave fitness curve given by equation (2.1) for M = 50. (b) Schematic representation of the three equilibria for M = 50 and varying μ, showing E1 (black), E2 (red) and E3 (blue). Normalized mean fitness (mean fitness divided by mean BPI fitness) of (c) genotypes  (black line);
  (red line) and
  (blue line), and (d) genes
  (black line) and
  (red line), for fixed values of pA. (e) Trajectories of genotype frequencies through time and (f) mean genotype fitness (scaled to maximal fitness of unity for no mitochondrial mutants), from an initial frequency pA = 0.01 at generation 100. Parameter values: M = 50, μ = 0.01.

