
Figure 3.
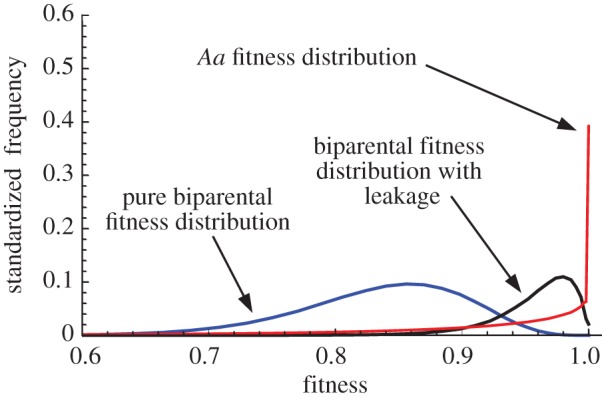
Fitness distribution of a population with strict biparental inheritance when pA = 0 (blue) showing a low mean owing to the accumulation of mitochondrial mutations. By contrast, at the equilibrium E1 (pA = 0.12), the fitness distribution of Aa individuals (red) with uniparental inheritance has many individuals having very high fitness (greater than 0.95) owing to repeated cleansing of mitochondrial mutations, although with high variance (AA individuals have a similar pattern, not shown). Leakage of this benefit can be seen in the fitness distribution of aa individuals (black), calculated at the equilibrium E1. Parameter values: M = 50, μ = 0.01.