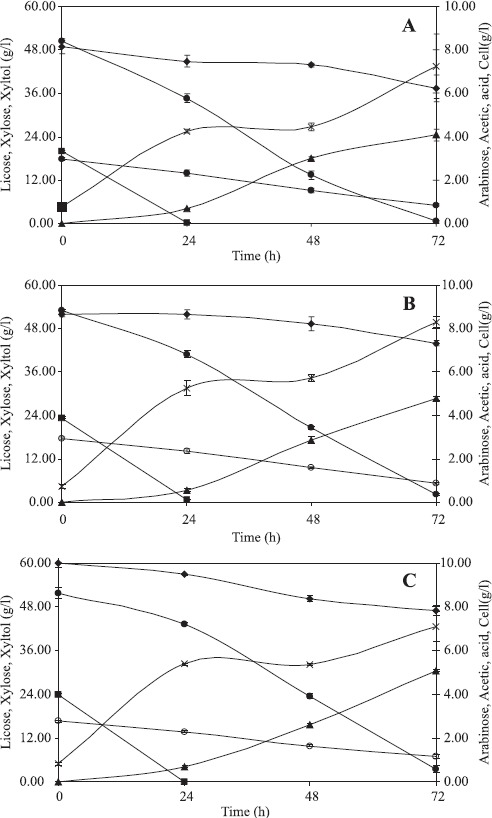
Figure 1.

Profiles of glucose (closed square), xylose (closed circle), arabinose (closed lozenge) and acetic acid (open circle) consumptions as well as of xylitol production (closed triangle) and of cell growth (X). Assays: A) HD1 + IP1, B) HD2 + IP1, C) HD2 + IP2. Average values of triplicates with standard deviations (error bars).
