Figure 1.

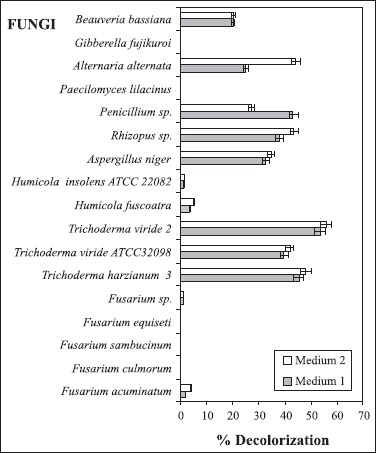
Decolorization activity of fungi in M1 and M2. Each data given are the mean value of three independent experiments. Standard deviations are shown on the graphs.

Decolorization activity of fungi in M1 and M2. Each data given are the mean value of three independent experiments. Standard deviations are shown on the graphs.