Figure 4.

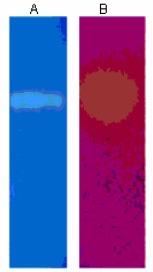
Zymogram of protease and lipase Lane A: Proteolytic activity indicated by a colorless band on a blue background; Lane B: Lipolytic activity indicated by a yellow band on a pink background

Zymogram of protease and lipase Lane A: Proteolytic activity indicated by a colorless band on a blue background; Lane B: Lipolytic activity indicated by a yellow band on a pink background